ART AS A BAROMETER OF CLIMATE changes
By Philip McCouat See reader comments on this article
introduction
Art may be conditioned by climate in different ways. The subject matter of realist artists will generally reflect their immediate surroundings, so there may be a tendency for artists from temperate climates to produce lighter-toned images than those produced by artists that habitually endure long, dark harsh winters .Even the size of paintings may be affected. So, for example, in sunny Southern Europe, churches had vast expanses of wall available to fill with paintings, because windows tended to be relatively small to keep out heat and light. In contrast, churches in colder Northern climates tended to have vast windows to admit as much heat and light as was available, limiting the area available or needed for paintings. This was one of the reasons that paintings from the north tended to be smaller than those from the south [1].
It is therefore a reasonable hypothesis that, when considered over a period of time, art may also be an indicator of changes in climate. This assumes some importance in the light of the current debate over long-term climate change. According to the balance of current scientific opinion, climate change is occurring on this planet, and human activities are contributing to it. However, among sections of the general public and some scientists, various aspects of this issue remain hotly disputed. Differences exist over whether there is any change occurring at all, whether it is temporary or permanent, the respective degrees to which the change is “natural” or human-caused, and even whether it matters in any event. This in turn has led to a level of political indecisiveness about what measures, if any, are needed to counter it – an indecisiveness that is magnified by factors such as the potential consequences of inaction, the likely cost and level of major responses, and the degree of international cooperation that may be required.
One vital aspect of this complex issue is the difficulty of measuring climate variations in previous eras, before comprehensive (or any) records were kept. This is important so that we can have some sort of baseline against which any current variations can be measured. This in turn has given rise to an intriguing question – to what extent can paintings or other artworks created during those earlier periods be regarded as accurate and reliable guides to atmospheric and weather conditions current at the time?
Clearly, there are a number of difficulties in such an exercise. Even limiting ourselves to those types of painting that are intended to reflect reality, uncertainties will inevitably arise -- the extent to which artists may tend to be selective or to overdramatise or exaggerate, the influence of artistic fashions or styles, possible inaccuracies arising from the artist’s skill-deficiencies or subjective approach, and so on. Notwithstanding this, some recent studies have suggested – perhaps surprisingly – that art may well have a role to play here. We shall deal with those studies shortly, in our discussion of the effect of water levels and volcanic eruptions. But first we should look at some of the other areas in which paintings have previously been suggested as diagnostic tools-- the role of prehistoric art, the origins of the Little Ice Age, and the retreat of the glaciers. In this discussion, our focus is not on determining the causes of climate variation, but simply on what artistic tools may be available to assist us in measuring it.
Pt 1: DECIPHERING CAVE AND ROCK ART
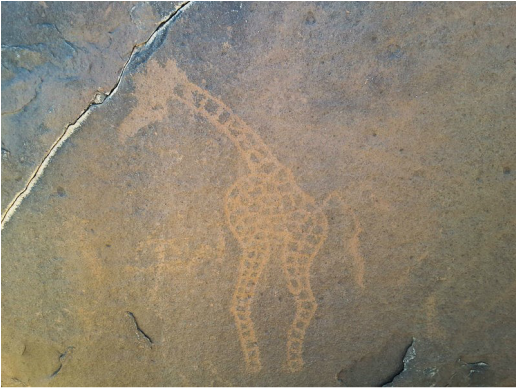
How much can we learn from ancient cave and rock art about climate variations in the past? Even in the absence of direct depictions, we can certainly get some indirect evidence from features such as the type of animals (particularly large mammals) that are shown. To take an obvious example, if paintings of reindeer or woolly mammoth appear regularly at a site, it is a fair guess that conditions were extremely cold at the time, whereas giraffes would indicate a much warmer environment. Such findings can be used to compare the climatic conditions applying to different regions in the same era. Also, by comparing such findings with current climate conditions in that same place we can get a rough guide to how the climate may or may not have changed there [1A].
We also know from associated bones or mummifications, or from species that have survived to the present day, that often these animals have been depicted with a very high degree of accuracy. These animals were vital to humans’ survival and were no doubt closely observed. Indeed, it has been found that some prehistoric representations of the gait of four-legged animals are more realistic than those of 19th century European artists, such as Degas [2].
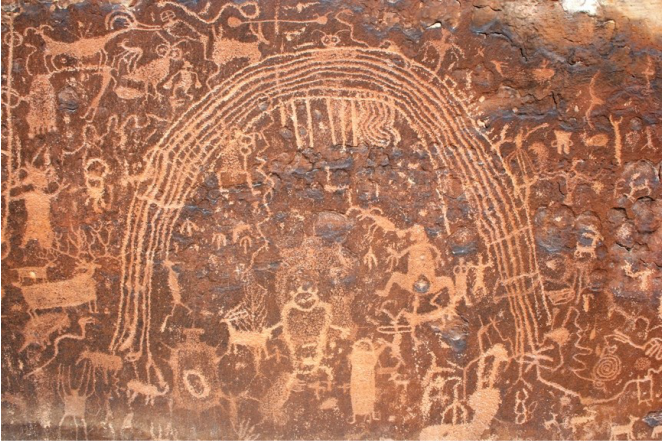
However, there are limits to the reliability of this type of evidence. The main problem is that ancient art, like art in more modern times, was not necessarily intended to be objectively representational in all cases. Some depictions may be partially or totally imaginary, such as the half-animal, half-human figures that appear in South African Bushman paintings [3] or the monstrous animals at Rochester Creek, Utah [4] (Fig 2). Others may be symbolic, metaphorical or ambiguous; or they may have religious or spiritual meanings that make them less representative of the actual environment [5].
Artistic motifs can also be culture-specific. As Paul Bahn notes, “a simple ‘V’ with a central line” may be identified as a trident, arrow, bird track or a vulva; and among Australia’s Walbiri people, a circle can signify a hill, tree, campsite, circular path, egg, breast nipple or entrance [6].
Bahn also cites the example of one researcher who identified a number of Aboriginal animal images using zoological reasoning, only to learn from an Aboriginal informant that out of 22 images, he had been wrong about 15, and had been only superficially right about the other seven [7].
The position is further complicated by the fact that many of these types of depiction may occur in the one area, as a “complex interweaving of the real and non-real” – even a single rock panel may include a mixture of mundane, literal, whimsical, religious, secular, mystical and metaphorical material [8]. Furthermore, even where the depictions look to us today to be quite realistic – as many do, often to an astonishing degree -- we cannot be sure, in the absence of other evidence (such as reliably-dated bones) that the animals actually existed at the time that they were painted, rather than being the product of some ancestral memory, myth or legend, or being attributable to some other reason entirely.
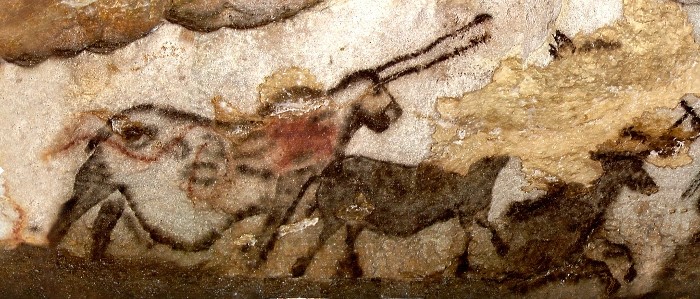
The oddness of the famous long-horned “licorne” from Lascaux (Fig 3) has, for example, been interpreted in various ways, including being due to a mistake by an inexperienced artist [9].
Similarly, the frequency of the appearance of a particular species does not necessarily indicate its frequency in reality [10]. This may be because particular species are emphasised in the art on the basis of their spiritual or magical significance, or because they represent a favoured food source, a long-maintained tradition, or simply because the artist particularly enjoys depicting them. In fact, certain animals may even be prominently represented in the art for the very reason that they are scarce – this may occur, say, where art is used to provide the magical assistance that is perceived as being necessary in hunting animals that are rare or difficult to hunt [11].
Cases also occur where new species make their appearance for the first time. For example, the appearance of a reindeer and musk-ox, both creatures typical of cold temperatures, overlaid over earlier depictions of animals typical of warmer climates, could reasonably suggest that there has been a change in climate [12]. The appearance of new types of foliage, or of domesticated animals, may suggest warming climates. And the frequency with which this occurs might suggest an unstable or variable climate [13].
Using the disappearance of certain species from the art record as evidence of climatic changes can also be productive, though it must be borne in mind that this may simply be attributable to a change in artistic style, or an environmental change unrelated to major climate variation. Care must be taken not to assume that absence means that the animals are extinct -- otherwise we may have to accept that there were hardly any children in those times, as they too appear in the art only rarely [14].
The reliability of these broad inferences about climate is strengthened where the paintings are prolific, internally consistent and spread over a considerable time. While some of the depictions may be imaginary, symbolic, spiritual, ancestral and so on, it would seem to be most likely that some and perhaps many of them represented objective reality at the time they were painted, especially where the depictions are supported by other archaeological evidence [15]. Even so, given the huge time scale and the problems associated with obtaining precise dating, the evidentiary value of cave and rock art is, in general, limited to being corroborative evidence, or a broad indication, of climate changes that occur over time.
Pt 2: DID BRUEGEL DEPICT THE START OF THE LITTLE ICE AGE?
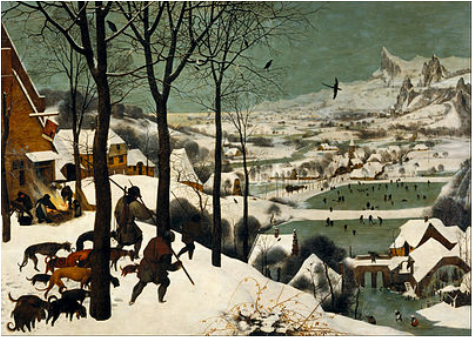
The European winter of 1564-65 was particularly harsh, and many have suggested that this was the inspiration for Pieter Bruegel the Elder’s now-famous Hunters in the Snow (1565) (Fig 4), probably the first fully-realised winter landscape in European art [see our article on Winter Landscapes]. Other works by Bruegel after this, such as The Census at Bethlehem (1566), were similarly snowy and this genre of landscape later became quite popular. The question then arises -- on the basis of this significant change, can it be argued that Hunters was an artistic signal of the beginning of the so-called “Little Ice Age”?
The Little Ice Age is a name commonly given to the period in Europe and various other regions from the 16th century through to the mid-19th century. It was marked by increased climate variability, periodic but inconsistent spells of extremely cold winters, an overall reduction in average temperatures and expansion of mountain glaciers [16]. The name itself, with its popular connotations of continuously icy conditions, woolly mammoths and so on, is rather simplistic and misleading. The impact was not continuous over the period and differed very substantially over various parts of the world. In addition, average reductions in temperature were quite small – perhaps of the order of one degree.
It seems clear that Hunters did represent an artistic breakthrough and a new style of landscape. However, there are good stylistic, religious and practical reasons why this did not occur earlier (see our article on Winter Landscapes). As none of these factors actually relate to changes in climate, the fact that Hunters depicted extreme cold therefore does not establish that Europe had not previously experienced such cold, any more than the later fashion that suddenly emerged for depicting moonlit scenes is evidence that the moon did not previously exist. In any event, there were convincing depictions of snowbound conditions in book illustrations dating from some 150 years before Bruegel, such as by the Limbourg Brothers in the February scene from the Tres Riches Heures du Duc de Berry (1412-16).
It also needs to be remembered that Hunters was intended as one of a series of paintings, originally called The Months, showing the cycle of rural life as seasons changed. As the December/January representative of this series, it is not surprising that Hunters should show wintry conditions. In addition, the perception by some that other scenes in the Months series were darker or gloomier than normal appears to depend on what you want to see. Other commentators have had quite different perceptions, describing Bruegel’s June painting, for example, as a “radiant expression of high Spring” and August as “the flat glowing scenery [that] is pure midsummer” [17].
Finally, it must be remembered that although Hunters is evidently based on close observation, it cannot be regarded as an accurate depiction of a particular time or place – if it were, we would have to explain how a large mountain range had somehow migrated into the Low Countries.
Of course, this is not to deny that the Little Ice Age began around this time. In fact, there is very substantial historical and other evidence supporting that view. But while the paintings by Bruegel certainly depict cold, snowy scenes, this could have been inspired by any cold winter – they cannot be taken as direct evidence that a major climate change was occurring. On the other hand, they are certainly consistent with that, and can therefore be seen as a non-conclusive but interesting corroboration of other more direct evidence.
A more general issue arises as to whether the 17th century Flemish and Dutch landscapes that followed Hunters, with their emphasis on low horizons and naturalistic outdoor effects, were influenced by the generally cooler weather conditions that prevailed at that time. There is evidence that this in fact may have occurred [18], but that is not the same as saying that those paintings therefore could be used as accurate measures of climate changes. The reason is that although these paintings were quite realistic, it seems that they were also extremely selective -- they tended to depict either very dramatic or very fine weather. This suggests that what they showed could not be taken to correspond to the average weather patterns [19] and could therefore not be used as a reliable barometer of what was actually happening to the weather.
PT 3: THE SHRINKING OF THE GLACIERS
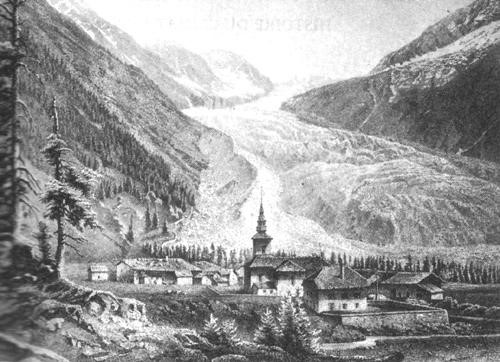
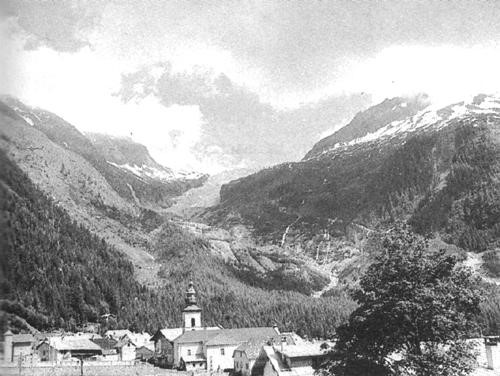
Particularly in Europe, the expansion of many mountain glaciers that occurred over the period of the Little Ice Age had some dramatic consequences for nearby human settlements. Michael Mann recounts how in the Chamonix Valley, near Mont Blanc, numerous farms and villages were lost to the advancing front of ice. The damage was so threatening that villagers summoned the Bishop of Geneva to perform an exorcism of the “dark forces” presumed responsible. Such instances were reportedly common during the 17th and 18th centuries, as glaciers in various regions expanded beyond their previous historical limits [20].
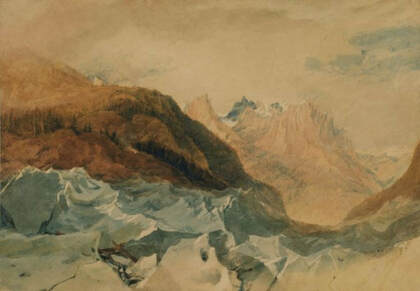
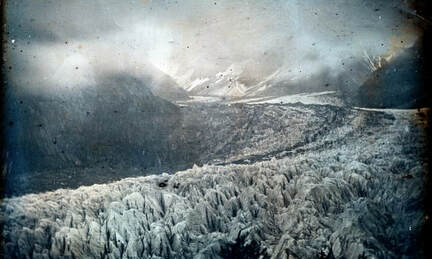
In Europe, this expansion appears to have petered out by the mid-19th century, when many glaciers began to retreat. The effect can be demonstrated by comparing paintings, engravings or drawings created at that time with more recent photographs of the same scene. The contrast today in the 21st century is particularly dramatic. A comparison of an 1806 sketch of the Mer de Glace, at Chamonix, France by JMW Turner, a photograph taken in 1854 (by John Ruskin and Frederick Crawley) and a photograph taken in 2018 (by Emma Stibbon) suggests that the glacier has retreated two kilometres in that period (Fig 5A) [20A].
In Europe, this expansion appears to have petered out by the mid-19th century, when many glaciers began to retreat. The effect can be demonstrated by comparing paintings, engravings or drawings created at that time with more recent photographs of the same scene. The contrast today in the 21st century is particularly dramatic. A comparison of an 1806 sketch of the Mer de Glace, at Chamonix, France by JMW Turner, a photograph taken in 1854 (by John Ruskin and Frederick Crawley) and a photograph taken in 2018 (by Emma Stibbon) suggests that the glacier has retreated two kilometres in that period (Fig 5A) [20A].
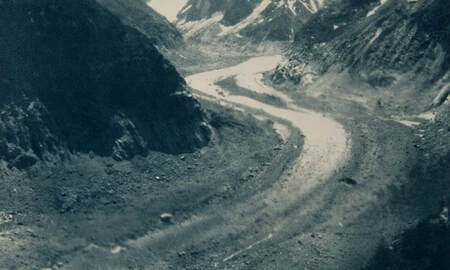
What is also interesting is that very substantial retreats were also evident even in photographs taken back in the 1950s and 1960s (Fig 5B). This indicates that the retreat was well under way during a period in which the likely influence of human activity, such as the burning of fossil fuels, was not a factor to the same extent as it is today. This may have implications in measuring the nature of this development and in analysing its causes.
Pt 4: THAT SINKING FEELING: MEASURING WATER LEVELS IN VENICE
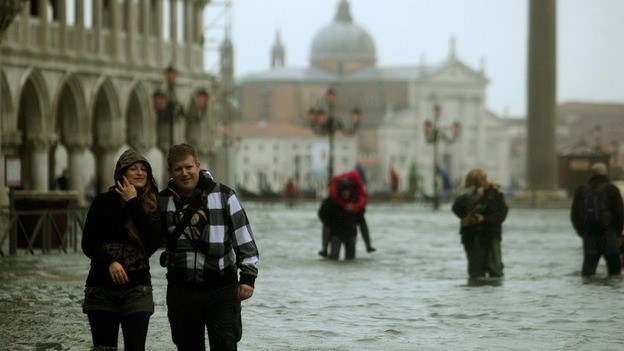
Venice is built on wooden pilings in low lying salt marsh islands in a lagoon, with access to the Adriatic Sea. It is therefore inherently vulnerable to changing sea levels. The city is gradually sinking, and flooding is common (Fig 6). These floods not only cause considerable inconvenience and damage, but also impregnate walls with sea salt, ultimately degrading stone and brickwork.
A number of factors have been identified as potentially contributing to this problem – subsidence due to extraction of underground water for industrial activities, excavation of canals, increased water traffic causing wakes and waves, and, more recently, global warming. It is exacerbated by the increasing frequency of “flooding tides” (acqua alta = high water) generated by sirocco wind storms.
A number of factors have been identified as potentially contributing to this problem – subsidence due to extraction of underground water for industrial activities, excavation of canals, increased water traffic causing wakes and waves, and, more recently, global warming. It is exacerbated by the increasing frequency of “flooding tides” (acqua alta = high water) generated by sirocco wind storms.
The problem has been recognised for some time. Regular instrumental records of the sea level, beginning in 1872, indicate that in the period from then until 1987 the combined effect of subsidence and rising sea level was a relative rise in level of about 30 cm. Counter-measures have also been undertaken. In particular the MOSE project [21] envisages the construction of adjustable barriers at the three entrances to the Venice lagoon [22]. These will rest on the sea floor but will be raised to form a dam across each entrance whenever a flooding tide event is threatened, thus insulating the city from the rise in water level.
USING PAINTINGS TO ASSESS HISTORIC WATER LEVELS
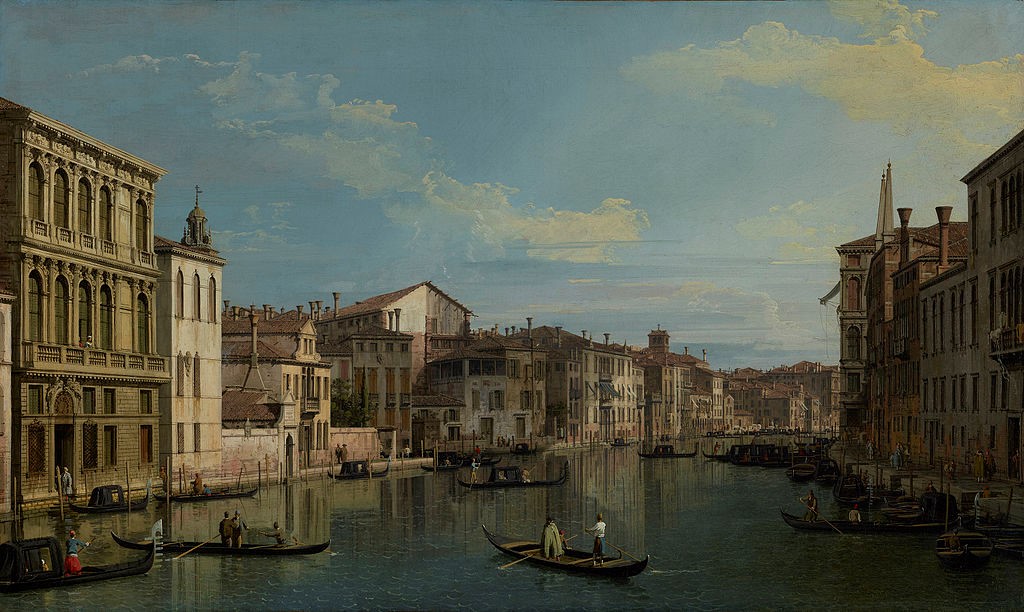
What use can paintings serve in analysing this difficult issue? Apparently, quite a lot. In fact, it appears that 18th century paintings by artists such as Antonio Canal (“Canaletto”) and his nephew Bernardo Bellotto can provide invaluable guidance as to the nature and extent of Venice’s problem before the time that records started being kept in 1872. In effect, art is being used to reconstruct the past. This is possibly due to the almost photographic precision of these two artists’ work, and comes about because both used the camera obscura to achieve their realistic effects (See more on Bellotto in our article on the Reconstruction of Warsaw).
A camera obscura typically consists of a box with a hole in one side. Light from an external scene passes through the hole and strikes a surface inside, where it is reproduced, inverting the image but retaining its colour and perspective. The image can be projected onto paper, and can then be traced to produce a highly accurate representation. Canaletto’s camera obscura has actually survived to this day, and is kept at the Correr Museum in Venice.
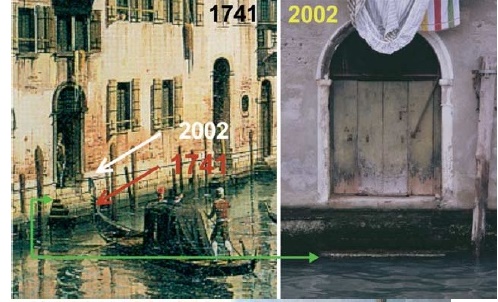
The camera obscura is especially useful for painters of panoramas, especially those containing high levels of detail, such as cityscapes. In the case of Venice, this remarkable precision even extends to the depiction of the level of the green-brown algae which live in the intertidal zone, and whose upper level on the walls of Venetian buildings indicates the average high tide level. While algal level may seem an unusual measuring stick, it is actually considered the official Venetian reference (“Commune Marino”) for the average sea level over which to establish the height of bridges, floors and buildings. In some buildings, it is even marked with “CM” on the wall.
Researchers led by Dario Camuffo have been able to use Canaletto’s and Bellotto’s 18th century paintings to compare algal levels at that time with current day levels and take this information into account in determining the rate at which Venice is sinking [23]. In determining which paintings to use, the researchers excluded those which depicted buildings that have since been altered, and checked all other objectively-verifiable details of the buildings depicted to confirm that the artist had achieved a reliable reproduction [24].
After correcting for changes attributable to the increased height of waves generated by motor boats, and the increase of the tidal wave after canal excavations, Camuffo concluded that the average high-tide level in Venice has risen by 60-80 cm since Canaletto’s time, with the proportional contributions of subsidence and sea level change remaining relatively steady.
Pt 5: ATMOSPHERIC EFFECTS OF VOLCANIC ERUPTIONS
It has been known for some time that major volcanic eruptions scatter aerosol particles into the Earth’s upper atmosphere. These particles remain there for a considerable period, typically for up to three years [25]. The effects may be visible to the naked eye around the planet, mainly through spectacular multi-coloured (particularly red) sunsets. They may also be associated with cooling conditions due to blocked sunlight, sometimes for quite prolonged periods -- particularly notable with the massive 1815 eruption of Tambora, which was followed by crop failures and "the summer that never was" [25A].
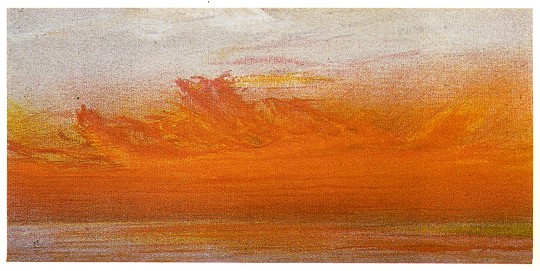
The best known of these eruptions in the modern era is probably the explosion of the volcano on the tiny Indonesian island of Krakatoa in August 1883 [26]. This threw billions of tons of ash and debris into the atmosphere and caused tsunamis that wiped out dozens of coastal villages, killing tens of thousands of people [27]. The volcanic cloud spread steadily westward and, by October/November 1883, most of the world was experiencing lurid multi-coloured evening displays, caused by the scattering of light by the atmospheric particles [28].
The spectacular sunsets caused public sensations world-wide. Typical was the response in New York: “People in the streets were startled at the unwonted sight and gathered in little groups on all the corners to gaze into the west. Many thought that a great fire was in progress.... People were standing on their steps and gazing from their windows as well as from the streets to wonder at the unusual sight”[29].
Similarly, In England, the Times of London reported: “The sunset last evening at Eastbourne surpassed anything of the kind seen on the south coast. The sky changed from a pale orange to a blood red, and it seemed as if the sea itself were one mass of flames” [30]. The poet Gerard Manley Hopkins described the vivid effects as “more like inflamed flesh than the lucid reds of ordinary sunsets… [T]he glow is intense. It has prolonged the daylight, and optically changed the season; it bathes the whole sky, it is mistaken for the reflection of a great fire” [31]. The poet Lord Tennyson was also moved to express his reaction in his St. Telemachus (1892):
Had the fierce ashes of some fiery peak
Been hurl’d so high they ranged about the globe?
For day by day, thro’ many a blood-red eve . . .
The wrathful sunset glared . . .
Not surprisingly, painters were also attracted. William Ascroft made pastel sky-sketches from the banks of the Thames at Chelsea, exhibiting more than 500 of them in the Science Museum [32] (Fig 8).
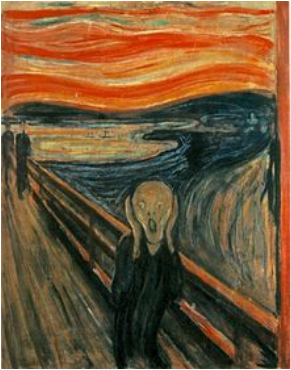
In Norway, where astronomers had witnessed the “very intense red glow that amazed the observers” [33], the artist Edvard Munch described the sky “as if a flaming sword of blood slashed open the vault of heaven … the atmosphere turned to blood – with glaring tongues of fire – the hills became deep blue – the fjord shaded into cold blue – among the yellow and red colours – that garish blood-red – on the road – and the railing – my companions’ faces became yellow-white – I felt something like a great scream – and truly I heard a great scream.” This passage aptly describes his famous work The Scream (1893) (Fig 9).
USING PAINTINGS TO MEASURE THE IMPACT
So, are paintings such as these just dramatic scenes, or do they carry genuinely valuable information about the impact of volcanoes on the atmosphere?
Various methods have been developed to measure the possible impact of volcanoes on climate. For example, the Dust Veil Index (DVI) is based primarily on historical accounts of optical phenomena, supplemented by surface radiation measurements and reports of cooling associated with volcanic aerosols. Another measure, the Volcanic Explosivity Index (VEI), incorporates various other sources of information; and the Ice Core Sulphate Index is based on measurements of volcanic sulphate deposited on glacial ice in the years immediately following an eruption [34].
In the past, there also have been various attempts to use paintings as indicators of climate variations over time. For example, Hans Neuberger examined some 12,000 paintings created during the period 1550-1849 and concluded that there had been a significant increase in cloudiness and darkness over that time [35]. The drawback to such a broad study is that one cannot tell how much the conclusions may be due to long term artistic practices, trends or styles, rather than actual changes in climate [36].
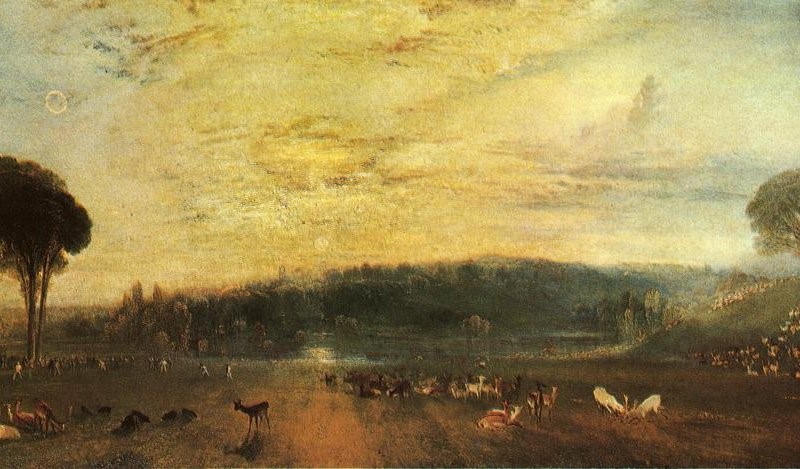
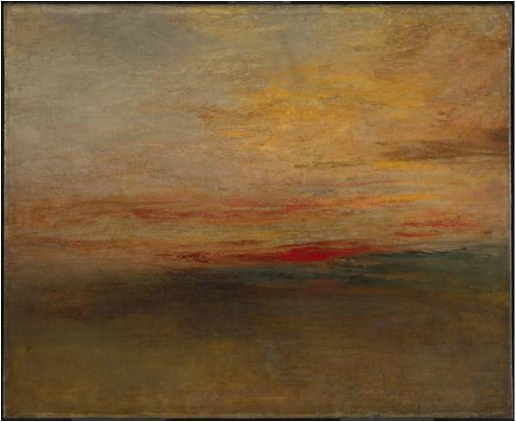
Recently, however, a methodology using paintings has been tested by some researchers, led by C S Zerefos of the National Observatory of Athens. Zerefos’ research compares depictions of sunsets in some 554 paintings by well-known artists from 1500 to 1900 before, during and in the three-year period after known eruptions [37]. These eruptions ranged from Awu (1641) to Krakatoa (1883) and the relevant artists include painters such as William Ascroft, Claude Lorraine, Pieter Bruegel, John Singleton Copley, Caspar David Friedrich, JMW Turner, Edgar Degas and Gustave Klimt.
The aim of the study was to find out if, and how much, the depictions of sunsets varied depending on whether they were done before or after a major volcanic event. The researchers did this by measuring the degree of redness of the sunsets in the paintings -- more technically, the chromatic Red Green (R/G) ratio [38].
In some limited cases, such as with Turner, Degas and Friedrich, direct comparisons of paintings at all three stages (pre-, during and post- volcanic) by the same painter were available. This of course was not possible with artists who had only painted examples of one or two of these stages; in that case, results were averaged over some hundreds of results. This methodology of this type of study, with its objective criterion (the red green chromatic index) and its comparison of paintings done before and after a specific, short-term, known event, seems to avoid many of the difficulties that have affected earlier studies.
Zerefos found that the measured average “redness” of depicted sunsets increased dramatically after each eruption [39]. Interestingly, the results were consistent over the various schools of painting. Even more importantly, however, there was also a high correlation between the values of the colouration depicted in the sunset paintings and the well-established DVI index of volcanic activity. The researchers conclude that artists “appear to have simulated the colours of nature with a remarkable precise colouration” [40]. Their depictions provide a surprisingly reliable and direct indicator of aerosol optical depth following major eruptions, especially for periods in which no measurements are otherwise available.
conclusion
This article aims to give a non-exhaustive snapshot of how some artworks may (or may not) be used in measuring contemporaneous changes in the climate. It will be clear that this varies from case to case, depending on the nature of the artwork – ranging from the cryptic to the photographically precise – and on the nature of the climate change in question. Thus, the range of animals depicted in prehistoric cave and rock art provides clues as to the nature of the climate at the time, subject to some important qualifications. Bruegel provides some non-conclusive corroboration of the start of the Little Ice Age. Depictions of glaciers in the mid-19th century provide a useful benchmark against which more recent glacial retreats can be measured. High precision 18th century paintings have been used to identify water levels in Venice in the period before records were kept. And studies of sunsets in a wide range of artworks seem to have provided us with surprisingly accurate indicators of the atmospheric effects of volcanic explosivity.
© Philip McCouat 2015, 2016, 2019
This article may be cited as “Art as a barometer of climate changes”, Journal of Art in Society, www.artinsociety.com
If you enjoyed this article you may also enjoy:
The emergence of the winter landscape
Bernardo Bellotto and the reconstruction of Warsaw
Return to the Journal’s table of contents at HOME
End Notes
1. Timothy Foote et al, The World of Bruegel, Time-Life International, London 1977 at 18-19. Of course, other non-climate factors were also relevant. These included the fact that small illuminated manuscripts such as Books of Hours were so influential in the development of Flemish art; and that for a considerable period in some Protestant countries, religious art in churches was firmly discouraged.
1A. Sometimes even seasonal variations can be identified. For example, the winter coat of horses in the Chauvet Cave in southern France includes a much shorter beard than its northern cousins, indicating a milder winter: R Dale Guthrie, The Nature of Paleolithic Art, Univ of Chicago Press, Chicago, 2005 at 74.
2. Joseph Stromberg, http://www.smithsonianmag.com/science-nature/cavemen-were-much-better-at-illustrating-animals-than-artists-today-153292919/?no-ist 5 December 2012.
3. Paul G Bahn, The Cambridge Illustrated History of Prehistoric Art, Cambridge University Press, 1998 at 231.
4. Bahn, op cit at 177.
5. These seem to appear more frequently in the more modern sites. They are sometimes indicated by their more stylised and repetitive appearance.
6. Bahn, op cit at 180.
7. Bahn, op cit at 177, citing N W G McIntosh, “Beswick Creek Cave: Two Decades Later”, in P J Ucko (ed) Forms of Indigenous Art, London, Duckworth, 1977.
8. Bahn, op cit at 221, citing Patricia Vinnicombe, People of the Eland, Pietermaritzburg, Natal University Press, 1976.
9. Guthrie, op cit.
10. Annette Laming, Lascaux: Paintings and Engravings, Penguin Books, Hammondsworth, 1959, at 126.
11. Laming, op cit at 127-8.
12. Unless it is assumed that those animals had simply adapted to a more temperate environment: Laming, op cit at 144, 149.
13. Before about 10,000 BCE: Guthrie, op cit at 22.
14. Bahn, op cit at 192. On the absence of children generally, see Guthrie, op cit, ch 3.
15. See Kieran D O’Hara, Cave Art and Climate Change, Archway Publ, 2014 for the view that cave art and climate change are even more inextricably linked.
16. Michael E Mann, “Little Ice Age”, in Encyclopedia of Global Environmental Change, Vol 1, p 504.
17. Timothy Foote, The World of Bruegel, Time-Life Books, Inc, 1971 at 176, 178.
18. H H Lamb, Climate, History and the Modern World, London, XIX, 1982, cited in Franz Ossing, “Paintings as a Climate Archive?” GFZ German Research Centre for Geosciences.
19. J Walsh, “Skies and reality in Dutch landscape”, in D Freedberg and J de Vries (Eds) Art in history: history in art; studies in seventeenth-century Dutch culture, Univ. of Chicago Press, 1991 at 95-117; Ossing, op cit.
20. Mann, op cit.
20A. Dalva Alberge, "Climate change ravages Turner's majestic glaciers" The Guardian, 6 January 2019.
21. Acronym for Modulo Sperimentale Elettromeccanico. Aptly, “Mose” is also the Italia name for Moses, who famously parted the Red Sea.
22. Justin Demetri, “Venice is Drowning”, 12 May 2015 http://www.lifeinitaly.com/tourism/veneto/sinking-venice.asp
23. Darlo Camuffo et al “The extraction of Venetian sea-level change from paintings by Canaletto and Bellotto”, ch 16 in Flooding and Environmental Challenges for Venice and its Lagoon (C A Fletcher et al), Cambridge University Press, 2005 at p 129; Darlo Camuffo et al, “Sixty cm submersion of Venice discovered thanks to Canaletto’s paintings”, Climate Change, June 2001 Vol 58, Iss 3, pp 333-343; Darlo Camuffo, “Canaletto’s paintings open a new window on the relative sea-level rise in Venice”, Journal of Cultural Heritage Vol 2 Iss 4, Oct-Dec 2001 227.
24. The eleven paintings ultimately used in the study were Canaletto’s Punta Dogana (1727), Grand Canal: the Rialto Bridge from the North (1727), The Grand Canal from Balbi Palace to Rialto (1730/1), The Grand Canal from Campo San Vio (1732), Entrance to Cannaregio with S Geremia Church (1735), The Grand Canal at S Maria della Carita looking S Vio (1735), The Grand Canal from Grimani Palace to Foscari Palace (1735), The Grand Canal from S Sofia Church to the Rialto Bridge (1758); and Bellotto’s The Grand Canal near S Stae Church (1740), Campo S Giovanni and Paolo (1741) and The Grand Canal from Flangini Palace to Vendramin Colergi Palace (1741).
25. See authorities collected in C S Zerefos et al, “Atmospheric effects of volcanic eruptions as seen by famous artists and depicted in their paintings”, Atmos Chem Phys 7, 4027-4042, 2007.
25A. See generally Gillen D'Arcy Wood, Tambora: The Eruption that Changed the World, Princeton University Press, 2014.
26. See generally Simon Winchester, Krakatoa: The Day the World Exploded, August 27, 1883, HarperCollins, New York, 2003.The invention of the telegraph in 1830 and the spread of the international cable network meant that when Krakatoa erupted, the news spread quickly, resulting in it becoming the first worldwide news story (Winchester, at 6). In contrast, word of the earlier 1815 Tambora eruption, which was many times larger, travelled no faster than a sailing ship, so limiting its popular news impact.
27. Richard Hamblyn, “The Krakatoa Sunsets”, Public Domain Review, 28 May 2012 http://publicdomainreview.org/2012/05/28/the-krakatoa-sunsets/
28. “Descriptions of the Unusual Twilight Glows in Various Parts of the World, in 1883-4” in The Eruption of Krakatoa, and Subsequent Phenomena: Report of the Krakatoa Committee of the Royal Society (1888) (Ed. G J Simmons).
29. New York Times, 28 November 1883, cited in Russell L Doescher, Donald W Olson and Marilynn S Olson, “When the sky ran red: the story behind The Scream”, Sky & Telescope. 107 2 (Feb. 2004) p 28.
30. 29 November 1883.
31. Hamblin, op cit; Richard D Altick, “Four Victorian Poets and an Exploding Island”, Victorian Studies 3 (March 1960), p. 258. Hopkins prepared a detailed report on the phenomenon which was published in the journal Nature, January 1884.
32. Hamblin, op cit.
33. Doeschler, op cit.
34. C S Zerefos et al, “Atmospheric effects of volcanic eruptions as seen by famous artists and depicted in their paintings”, Atmos Chem Phys 7, 4027-4042, 2007; C S Zerefos et al, “Further evidence of important environmental information content in red-to-green ratios as depicted in paintings by great masters, Atmos Chem Phys 14, 2987-3015, 2014.
35. Hans Neuberger, “Climate in Art”, Weather, 25, 2 46-56; cited in Ossing, op cit.
36. Ossing, op cit.
37. Zerefos, op cit.
38. As adjusted for the solar zenith angle for each painting (R/G). This ratio is evidently stable irrespective of the age of the painter.
39. As a separate finding, paintings created in non-volcanic years also demonstrated a general background increase over the period from the mid-19th century to the mid-20th century.
40. Zerefos, op cit.
© Philip McCouat 2015, 2016, 2019
This article may be cited as “Art as a barometer of climate changes”. Journal of Art in Society, www.artinsociety.com
If you enjoyed this article you may also enjoy:
The emergence of the winter landscape
Bernardo Bellotto and the reconstruction of Warsaw
Return to the Journal’s table of contents at HOME
